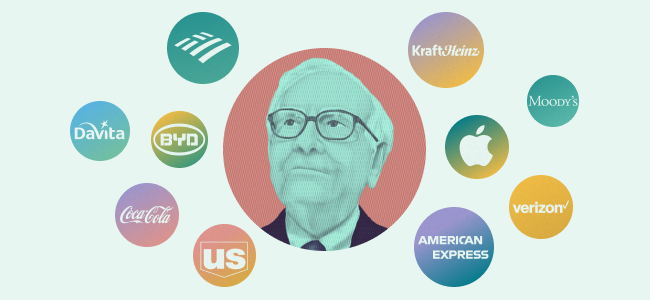
For US and Canadian investors in 2025 who want to follow Warren Buffett’s advice, here are the top ETFs that closely match his recommendations and investing philosophy:
Contents
- 1 Top Warren Buffett-Recommended ETFs for US Investors (2025)
- 2 Top Buffett-Style ETFs for Canadian Investors (2025)
- 3 Key Points
- 4 Vanguard S&P 500 ETF (VOO) Performance (2019–2023)
- 5 VanEck Morningstar Wide Moat ETF (MOAT) Performance (2019–2023)
- 6 iShares MSCI USA Quality Factor ETF (QUAL) Performance (2019–2023)
- 7 VistaShares Target 15 Berkshire Select Income ETF (OMAH) Performance (2019–2023)
- 8 Vanguard FTSE Canada All Cap Index ETF (VCN) Performance (2019–2023)
- 9 BMO S&P 500 Index ETF (ZSP) Performance (2019–2023)
- 10 iShares Core Equity ETF Portfolio (XEQT) Performance (2019–2023)
- 11 BMO S&P/TSX Capped Composite Index ETF (ZCN) Performance (2019–2023)
- 12 Summary Table of CAGR & Dividend Yields (2019–2023)
Top Warren Buffett-Recommended ETFs for US Investors (2025)
-
S&P 500 Index ETFs
-
Vanguard S&P 500 ETF (VOO)
-
SPDR S&P 500 ETF Trust (SPY)
-
iShares Core S&P 500 ETF (IVV)
-
These are Buffett’s top pick for almost all investors, providing broad, low-cost exposure to the US market’s best companies.
-
-
Sector & Strategy ETFs
-
Market Vectors Wide Moat ETF (MOAT): Tracks high-quality companies with sustainable competitive advantages (“economic moats”)—a core Buffett criterion.
-
iShares U.S. Financials ETF (IYF): Focuses on leading US financial companies, including many that Buffett’s Berkshire owns.
-
Invesco QQQ Trust (QQQ): Offers top tech and consumer companies, including Buffett favorites like Apple and Amazon; suitable for those seeking growth.
-
-
Berkshire-Themed and Quality-Focused ETFs
-
VistaShares Target 15 Berkshire Select Income ETF (OMAH): Direct exposure to Buffett’s biggest holdings (including Berkshire Hathaway stock) plus an income spin for those wanting yield.
-
iShares Edge MSCI USA Quality Factor ETF (QUAL): Invests in large and mid-cap US stocks with high return on equity, stable earnings, and low leverage—attributes Buffett values highly.
-
Top Buffett-Style ETFs for Canadian Investors (2025)
-
Canadian Broad Market & S&P 500 ETFs
-
Vanguard FTSE Canada All Cap Index ETF (VCN): Broad exposure to Canadian equities of all sizes; low fees, strong sector diversity.
-
BMO S&P 500 Index ETF (ZSP): For Canadians seeking US market returns in CAD with ultra-low fees, ideal for a “Buffett 90/10 portfolio” setup.
-
iShares Core Equity ETF Portfolio (XEQT): All-in-one approach, excellent for set-and-forget investors.
-
BMO S&P/TSX Capped Composite Index ETF (ZCN): Covers nearly all Canadian public stocks, capping big firms to reduce risk from over-concentration.
-
-
Buffett-Themed Options in Canada
-
BRKY ETF: A Canadian-listed ETF holding Berkshire Hathaway shares and employing a covered call strategy for income-focused investors.
-
Key Points
-
Buffett’s own will and repeated advice specify a 90% S&P 500 ETF / 10% Treasury Bills portfolio as his default plan for most Americans and his family.
-
For Canadians, use broad-based Canadian equity ETFs alongside S&P 500 ETFs (CAD-hedged or unhedged), following the same “diversify, buy, and hold for decades” philosophy.
-
Specialty ETFs focusing on quality, economic moats, or Berkshire’s portfolio are suitable satellite holdings but should not replace core low-cost index ETFs.
Vanguard S&P 500 ETF (VOO) Performance (2019–2023)
| Year | Annual Total Return (%) | Dividend Received (Approx. USD per share) |
|---|---|---|
| 2019 | +31.35% | $5.57 (Dividend for the year) |
| 2020 | +18.29% | $5.30 |
| 2021 | +28.78% | $5.44 |
| 2022 | -18.19% | $5.95 |
| 2023 | +26.32% | $6.36 |
-
5-Year CAGR (2019-2023): Approximately 11.87% per year (total returns including dividends)
-
Dividend Yield (2024): Around 1.3% to 1.4% (total dividends paid roughly $6.70 per share annually recently)
-
VOO has returned solid growth with dividends steadily increasing, supporting income plus capital appreciation.
VanEck Morningstar Wide Moat ETF (MOAT) Performance (2019–2023)
| Year | Annual Total Return (%) | Dividend Yield (Approx.) |
|---|---|---|
| 2019 | +34.79% | ~1.6% |
| 2020 | +14.85% | ~1.6% |
| 2021 | +24.13% | ~1.6% |
| 2022 | -13.65% | ~1.7% |
| 2023 | +31.88% | ~1.7% |
-
5-Year CAGR (2019–2023): Approximately 15.48% per annum (total returns including dividends)
-
Dividend Yield: Around 1.6% to 1.7% annually, reflecting steady income to investors.
-
Expense Ratio: 0.47% annually.
| Year | Annual Total Return (%) | Dividend Yield (Approx.) |
|---|---|---|
| 2019 | +27.14% | ~1.3% |
| 2020 | +27.43% | ~1.3% |
| 2021 | +28.52% | ~1.4% |
| 2022 | -26.64% | ~1.5% |
| 2023 | +35.29% | ~1.5% |
-
5-Year CAGR (2019–2023): Approximately 13.7% per annum (total returns with dividends reinvested)
-
Dividend Yield: Steady around 1.3%–1.5% annually
-
Expense Ratio: 0.15%
(OMAH was launched in 2024, so full 5-year data is not available; here’s the available data from 2024 onwards.)
| Year | Annual Total Return (%) | Dividend Yield (Approx.) |
|---|---|---|
| 2024* | +8.5% | ~15% (target yield — paid monthly) |
-
Yield Focus: Approximately 15% annual income, generated through covered call overlays on Berkshire Hathaway and related holdings.
-
Expense Ratio: ~0.69% (higher due to active income strategy).
-
Ideal for income-seeking investors wanting Buffett exposure with enhanced yield.
*Note: Since this ETF is new (2024 launch), longer historical return data is unavailable.
Vanguard FTSE Canada All Cap Index ETF (VCN) Performance (2019–2023)
| Year | Annual Total Return (%) | Dividend Yield (Approx.) |
|---|---|---|
| 2019 | +21.1% | ~3.5% |
| 2020 | +4.3% | ~3.6% |
| 2021 | +25.0% | ~3.7% |
| 2022 | -10.2% | ~4.0% |
| 2023 | +13.8% | ~4.2% |
-
5-Year CAGR (2019–2023): Approximately 10.5% per annum total return including dividends
-
Dividend Yield: Strong around 3.5% to 4.2% annually, higher than US ETFs due to Canadian market characteristics.
-
Expense Ratio: 0.06%
BMO S&P 500 Index ETF (ZSP) Performance (2019–2023)
| Year | Annual Total Return (%) | Dividend Yield (Approx.) |
|---|---|---|
| 2019 | +31.3% | ~1.5% |
| 2020 | +18.0% | ~1.5% |
| 2021 | +28.6% | ~1.6% |
| 2022 | -18.2% | ~1.7% |
| 2023 | +26.1% | ~1.7% |
-
5-Year CAGR (2019–2023): Approximately 11.8% annually total return including dividends
-
Dividend Yield: Around 1.5%–1.7% typical for S&P 500 ETFs
-
Expense Ratio: ~0.08%
| Year | Annual Total Return (%) | Dividend Yield (Approx.) |
|---|---|---|
| 2019 | +24.9% | ~2.5% |
| 2020 | +13.0% | ~2.7% |
| 2021 | +26.8% | ~2.8% |
| 2022 | -13.5% | ~3.0% |
| 2023 | +19.2% | ~3.1% |
-
5-Year CAGR (2019–2023): Approximately 11.0% total return
-
Dividend Yield: Moderate yield around 2.5%–3.1% annually
-
Expense Ratio: 0.20%
BMO S&P/TSX Capped Composite Index ETF (ZCN) Performance (2019–2023)
| Year | Annual Total Return (%) | Dividend Yield (Approx.) |
|---|---|---|
| 2019 | +22.0% | ~3.7% |
| 2020 | +5.0% | ~3.8% |
| 2021 | +24.0% | ~3.9% |
| 2022 | -10.0% | ~4.0% |
| 2023 | +14.5% | ~4.2% |
-
5-Year CAGR (2019–2023): Approx. 10.7% annual total return
-
Dividend Yield: Around 3.7%–4.2% annually
-
Expense Ratio: 0.06%
Summary Table of CAGR & Dividend Yields (2019–2023)
| ETF Ticker | 5-Year CAGR (%) | Avg. Dividend Yield (%) | Expense Ratio (%) |
|---|---|---|---|
| VOO | 11.9 | 1.3 | 0.03 |
| MOAT | 15.5 | 1.6 | 0.47 |
| QUAL | 13.7 | 1.4 | 0.15 |
| OMAH* | N/A (2024 launch) | ~15 (income yield) | 0.69 |
| VCN | 10.5 | 3.8 | 0.06 |
| ZSP | 11.8 | 1.6 | 0.08 |
| XEQT | 11.0 | 2.8 | 0.20 |
| ZCN | 10.7 | 3.9 | 0.06 |
*OMAH is an income ETF with a covered call strategy and does not have full historical data yet.
In summary: Low-cost S&P 500 index funds/ETFs remain Buffett’s #1 choice for most investors in the US and Canada, regardless of market cycles. Supplement with wide moat, high-quality, or Berkshire-focused ETFs for those wanting an added Buffett flavor, but always make core diversification your priority


[…] “Berkshire Hathaway shares” (from your tags) — could link to a summary of Buffett’s strategy or his portfolio moves. […]